2024 Olympics - Seine Water Quality
Disclaimer and Copyright Notice
Table of contents
Introduction
Fluidion's 2024 Olympics Open Data Initiative
General data (pre- and during 2024 Olympics)
Focus on the Olympic Events
The Fluidion Water Quality Color Chart
Last three measurements (Seine River, Alexandre III bridge)
All 2024 summer season results (April 8 - September 27, 2024)
Data for specific Olympic events
Women's and Men's Paratriathlon (September 2, 2024)
Men's Marathon Swimming (August 9, 2024)
Women's Marathon Swimming (August 8, 2024)
Olympic Mixed Relay Triathlon (August 5, 2024)
Olympic Men's and Women's Triathlon (July 31, 2024)
Olympic opening ceremony (July 26, 2024)
Additional confirmatory data
Molecular DNA analyses
Explanations
Laboratory MPN vs. Planktonic vs. Comprehensive E.coli counts
Science explained
Methodology
Data access and legal
Open data availability
Disclaimer and Copyright Notice
Fluidion's 2024 Olympics Open Data Initiative
Focus on the Olympic Events
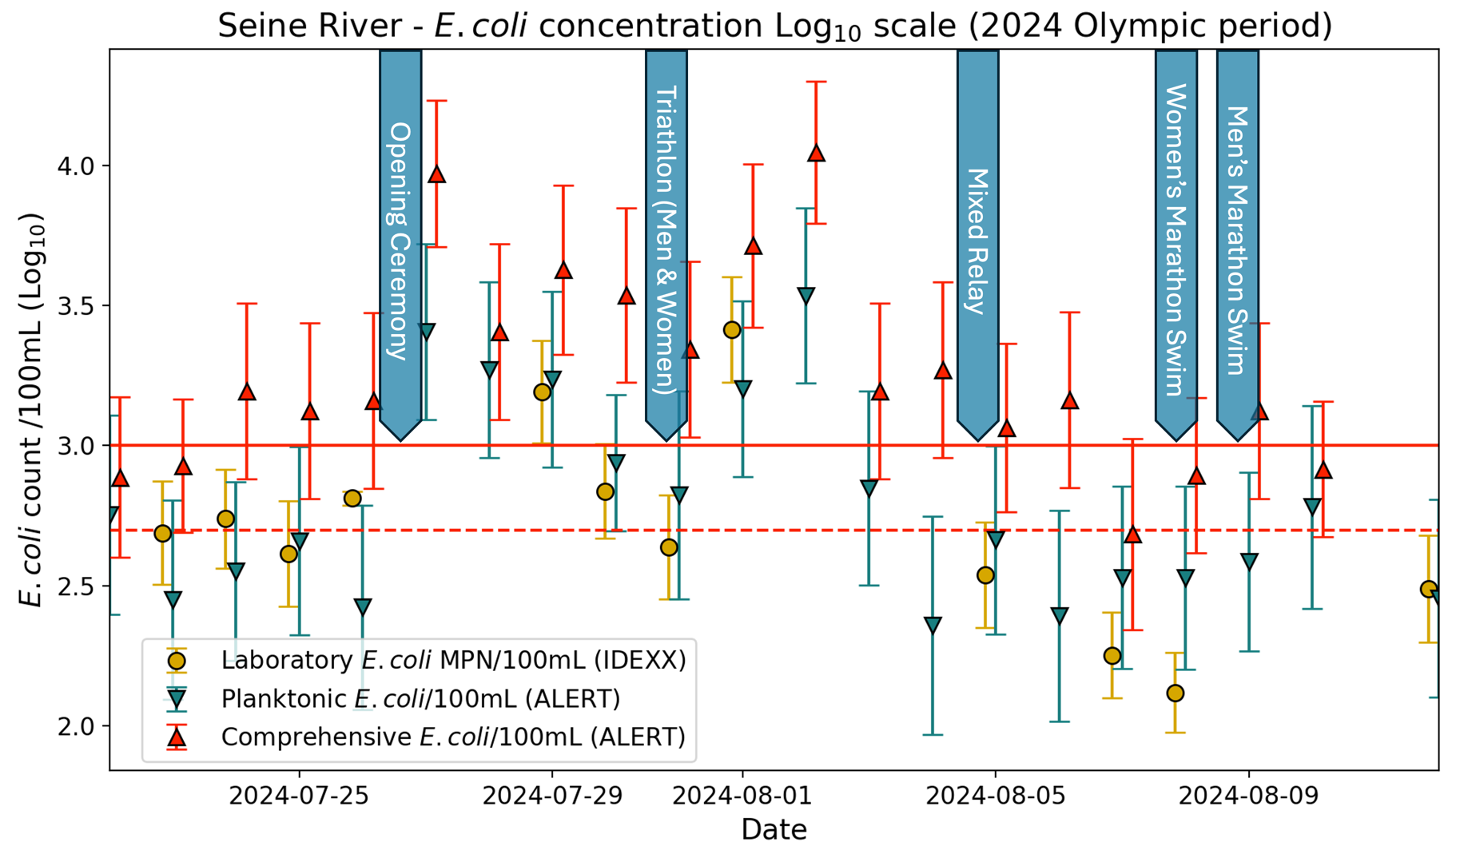
The data corresponding to the 2024 Olympic period are highlighted in the following graphs, allowing a focus on trends that were observed during the actual events. Figures are plotted using logarithmic scales for the bacterial concentration axis. Whenever multiple measurements were performed on a single day, their geometric mean is shown.
The E. coli concentrations obtained from ALERT instrumentation (comprehensive - red triangles - and planktonic - green inverted triangles) are juxtaposed with the MPN laboratory E. coli concentration (gold circle). The error bars represent the 95% confidence interval for each measurement. The different data series were slightly offset for improved graph legibility.
Thresholds
The horizontal solid red line represents 1000 E.coli/100mL, while the dashed line representes 500 E.coli/100mL. These correspond to the guidelines for good inland water quality published by the World Triathlon.
The Fluidion Water Quality Color Chart
Days when the water qualilty is acceptable as per the World Triathlon limit are shown in a shade of blue and are decorated with a chack mark ✓. On the other hand, days when water quality is unacceptable are shown in red and marked with a ✗ sign.
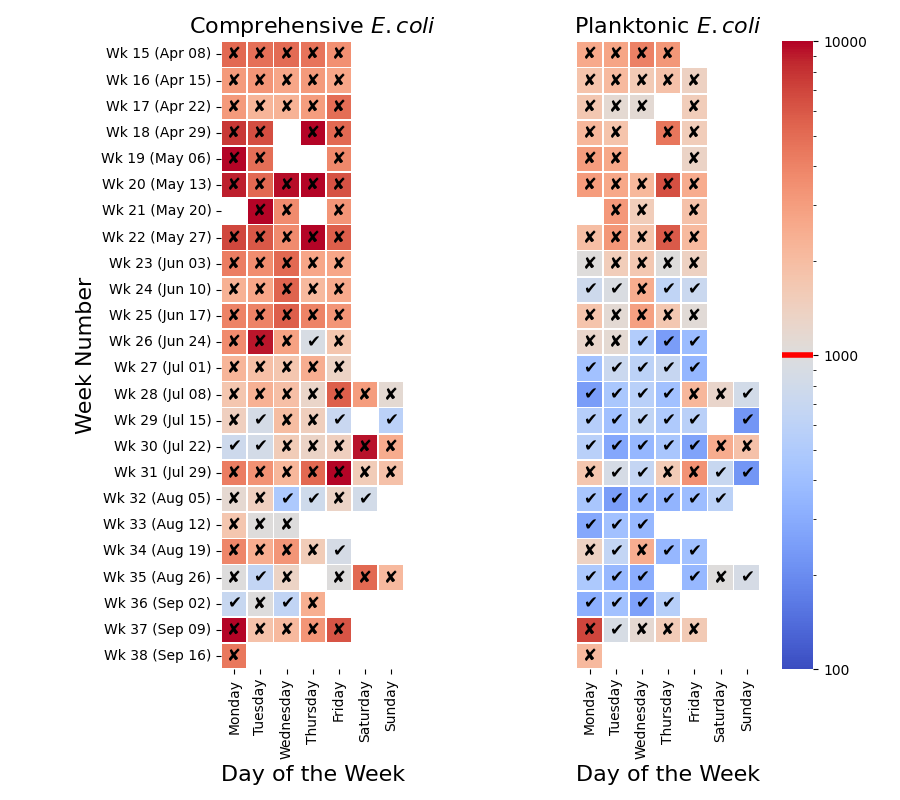
For example, on Wednesday July 31st, when the women's and men's World Triathlon events were held, the water quality was acceptable by the planktonic E.coli count, but was above the limit by the comprehensive E.coli count.
This creates a contradiction, and for good reason. The answer is in the fact that the Seine river contains large quantities of aggregate-bound bacteria that are invisible to the laboratory methods and not included in the planktonic count. But the comprehensive count from our ALERT instrument accounts for all the E.coli present, including those on aggregates. It is easy to understand how the comprehensive count provides a more accurate assessment of risk: bacterial aggregates, such as E.coli-rich fecal or sediment particles. are powerful and resilient infectious vectors, in a way like vessels that transport and protect the E.coli bacteria and all the associated pathogens. The currently approved lab methods are inadequate for risk assessments in waters containing large amounts of aggregate-bound E.coli. This is the case of many urban rivers that are affected by sewer overflows.
For details about the water quality prior to and during the Olympic Triathlon, please click here.
Last three measurements (Seine River, Alexandre III bridge)
The dashboard below displays the results for the latest three days, illustrating both the values obtained using standard laboratory techniques and those provided by Fluidion® ALERT rapid microbiology instrumentation. Whenever multiple measurements were performed on a single day, their geometric mean is shown.
Standard culture-based laboratory methods for measuring E. coli, such as the most probable number method and membrane filtration and plating, cannot differentiate between individual bacteria and those clumped together in aggregates. In contrast, ALERT technology can accurately quantify both planktonic (free-floating) bacteria and those within aggregates. This capability provides a vital additional dimension of information for risk assessment, as fecal particles or aggregates loaded with pathogens and indicator bacteria can represent a substantially higher health risk. Thus, ALERT measurements report both planktonic and comprehensive E. coli counts.
Following the dashboard presenting the latest results, we provide graphs that plot the data across the entire intensive sampling period for 2024, beginning April 8, in both linear and logarithmic scales. Additionally, 95% confidence intervals are included to convey the uncertainty associated with the data. Relevant environmental factors, such as rainfall and river discharge, are also provided to aid in data interpretation.
Further details on how these data were collected can be found in the Methodology section below.
The data presented here undergo quality control by Fluidion scientists, which may lead to occasional delays in data availability. Any errors detected in the data are unintentional and corrected immediately.
All results (starting April 8, 2024)
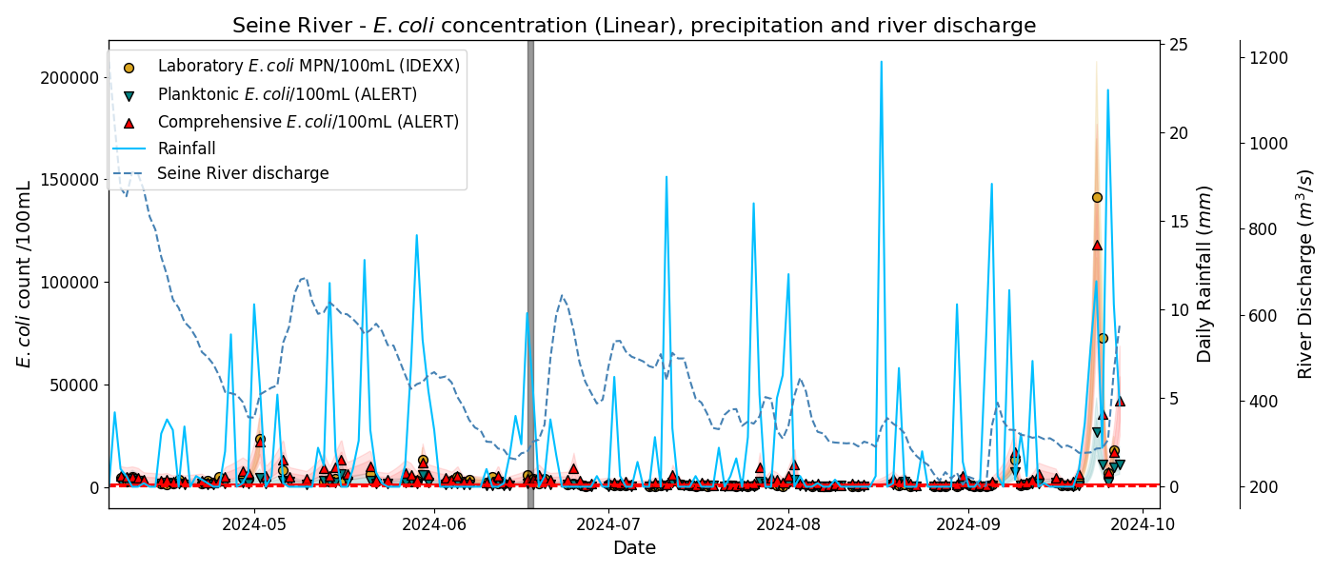
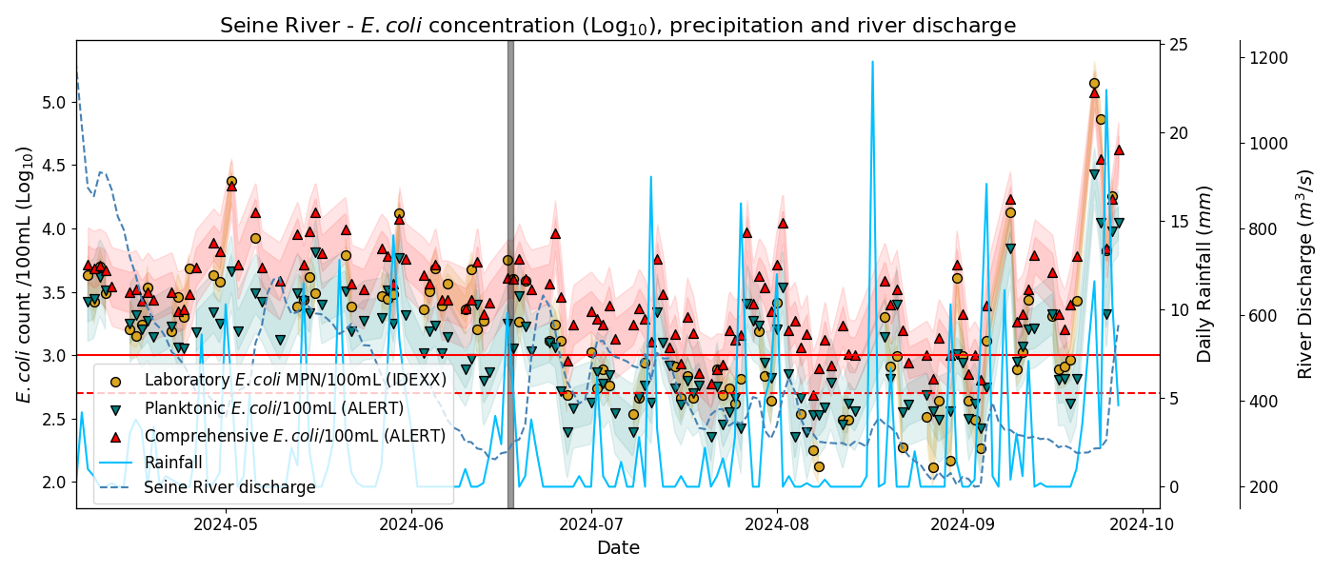
The following figures provide the time-series data since early April, when our high-frequency monitoring efforts started. E. coli concentrations obtained from ALERT instrumentation (comprehensive - red triangles; planktonic - green inverted triangles) are juxtaposed with the MPN laboratory E. coli concentration (gold circle). Local environmental factors are shown as well: daily precipitation (light blue line) and mean river discharge (dashed blue line). Standard deviation and 95% CI are shown as colored bands. Whenever multiple measurements were performed on a single day, their geometric mean is shown.
The first time when the Austerlitz undeground water storage tank was operationally used is shown as a vertical gray line (during the rain event on June 17-18, 2024). The information regarding the Austerlitz tank usage was obtained from this page, maintained by the City of Paris.
Figures are plotted using both linear and logarithmic scales for the bacterial concentration axis. The linear scale provides better visibility of the water quality exceedances., while the logarithmic scale is typical for analyzing bacterial concentration data, which is best modeled by a log-normal distribution.
The juxtaposition of environmental factors allows observing their effect on water quality. This is particularly true of rainfall, which can generate river pollution by combined sewer overflows.
Thresholds
The horizontal solid red line represents 1000 E.coli/100mL, while the dashed line represents 500 E.coli/100mL. These correspond to the guidelines for good and, respectively, very good inland water quality for swimming, published by the World Triathlon.
Women's and Men's Paratriathlon (September 2, 2024)
September 2, 2024 (23:50 pm)
We are excited to announce that our measurements performed on the 10:00am samples, collected right at the end of the Paratriathlon event at the Alexandre III bridge, provided water quality results that are acceptable according to the Water Triathlon safety thresholds, for both the planktonic count (geometric mean: 316 E.coli/100 mL) and the comprehensive count (705 E.coli/100 mL).
This demonstrates that obtaining acceptable water quality in Paris is not a utopia, but that the right conditions need to be met - in this case, sunny weather, low river discharge and lack of disturbances from boat traffic. This allows for UV disinfection and sedimentation to take place, which reduces the planktonic and, respectively, the comprehensive count. This conclusion is reinforced by the Seine and the Marne rivers being significantly more polluted at their confluence at Alfortville, than at the downstream Alexandre III competition site.
All in all, this shows that good water quality is possible under the perfect conditions, and provided very careful monitoring to ensure the safety of users. So, could public swimming in Paris become a reality for next year? An optimistic thought for the end of the 2024 Olympics !
September 1, 2024 (20:20 pm)
Today's scheduled events were postponed to tomorrow, which was the correct decision in view of the poor water quality results that we observed. So, how about tomorrow? What do today's tests tell us?
The situation is a little better than yesterday, but not by a lot, unfortunately. E.coli levels recorded this morning at 9am at the Alexandre III bridge in Paris, which is the Olympic venue for the Paratriathlon, were of 868 E.coli/100 mL (planktonic count), which is just under the threshold of 1000 set by the World triathlon. However, the river continues to be highly polluted by E.coli-rich fecal particles, which cannot be measured using the standard methods used by the organizers. When taken into account, these raise the comprehensive E.coli count to 2119 E.coli/100 mL, which is over twice the limit, suggesting unsafe conditions.
Furthermore, both the Seine and Marne rivers just outside of Paris are also quite polluted. At Alfortville, just upstream of their confluence, the Seine river measured 1356 (planktonic) and 11,000 (comprehensive) E.coli/100 mL, whereas the Marne river (a smaller tributary) measured 565 (planktonic) and 2119 (comprehensive) E.coli/100 mL. This suggests that the City of Paris is polluted from sewer overflows occuring upstream, primarily in the Seine river, which cannot be cleaned up easily.
Tomorrow's event start under the threat of poor water quality. We can be almost confident that, should the events proceed tomorrow, the athletes will be competing in the same type of water that is in a "gray-zone" safety-wise. We hope their immune systems will be strong !
August 31, 2024 (20:00 pm)
We received the analysis results from that water samples collected earlier today, and they are unfortunately not promising. The planktonic count came in at 1012 E.coli/100 mL, just above the World Triathlon threshold for acceptable water quality. The comprehensive count, on the other hand, registered at 5173 E.coli/100 mL, a factor of 5 higher than the acceptable limit. This means that the river is quite loaded with E.coli-rich fecal and sediment particles, and today's water quality readings raise very serious questions about the safety of the river for tomorrow's scheduled Paratriathlon events. We know that the pollution with fecal particles, that we are witnessing now, takes significant longer to recover.
This pollution is the result of the rainfall yesterday (10.3mm), which has created a series of CSOs in the Seine and Marne rivers upstream of Paris, and possibly within the City of Paris as well. Since this was only a moderate rain event, smaller than the ones that disrupted the Olympic Opening Ceremony and Triathlon back in July, and since it came after a long dry period, we were expecting that the Austerlitz storage tank might have contained the pollution. Unfortunately, that does not seem to be the case.
We will be monitoring the event tomorrow morning. so stay tuned. We are wishing that the organizers will take the measures required to protect the health of the athletes.
Men's Marathon Swim (August 9, 2024)
August 9, 2024 (21:00 pm)
We received the results from four water samples taken earlier today during the Men's Marathon Swimming Event. The samples were collected at 7:30 AM, 8:30 AM, 9:00 AM, and 9:30 AM, yielding the following planktonic E.coli counts (per 100 mL): 243, 496, 371, and 496. All these values were below the World Triathlon threshold of 1000 E.coli/100 mL. However, comprehensive counts indicated slightly degraded water quality, with measurements of 867, 4132, 1338, and 650. Two of these samples exceeded the safety threshold, with a peak of contamination occurring shortly after the event began.
The geometric mean for all samples collected during the event was 386 E.coli/100 mL (planktonic) and 1329 E.coli/100 mL (comprehensive), indicating that the water quality remained in a risk-prone "gray zone." The water was contaminated with fecal E.coli-rich particles at certain points, reaching levels up to four times the World Triathlon threshold.
Congratulations to the athletes who competed, and let's hope that everybody stays healthy!!!
August 8, 2024 (22:00 pm)
The results from today's samples, collected during and just after the Women's Marathon Swimming event, have shown consistent good water quality for both planktonic and comprehensive E.coli counts, with geometric mean at 297 E.coli/100 mL (planktonic) and, respectively, 705 E.coli/100 mL (comprehensive).
The MPN laboratory count will arrive tomorrow morning, but based on today's samples so far, and provided stable weather conditions and no accidental pollution, water quality should be good for Men's Marathon Swimming event tomorrow! We'll be watching !
Women's Marathon Swim (August 8, 2024)
August 8, 2024 (22:00 pm)
The results from the competition this morning have arrived, and are very reassuring. The planktonic and comprehensive counts for all four measurements performed showed values below the World Triathlon upper limit of 1000 E.coli/100 mL. This proves that the combination of good weather, low river discharge, and limited sewage discharge can actually create safe conditions for swimming in the Seine river. Attentive monitoring is key, as we have seen that this equilibrium is very unstable and water quality can be quite dynamic.
Time Planktonic (E.coli/100 mL) Comprehensive (E.coli/100 mL)
07:30am 139 867
08:36am 496 867
09:30am 425 650
10:15am 267 506
August 8, 2024 (7:00 am)
The results from the second sample from August 8 (collected 12:22pm) are in, and are good: planktonic count 308, comprehensive count 642 E.coli/100mL This confirms the results published last night, bringing the geometric mean for planktonic E.coli to 338, and the comprehensive mean to 483 E.coli/100 mL., and indicate that, in the current good weather stability conditions, the results are likely to be good this morning as well. We will have that confirmation a little bit later !
August 7, 2024 (23:50 pm)
The results have arrived from the 11:50am sample today, and are rather reassuring - looks like water quality is finally stable, with low planktonic and comprehensive counts (371 and, respectively, 364 E.coli/100 mL - the inversion is just a matter of noise in the data). This suggests that sunny weather, low river discharge, lack of rain, and the expensive capture infrastructure built for the Games finally got it right, and the water seems to have been of good quality today!
We will have results arriving from one additional sample later in the night, but given the stable weather and the calm river, we do not expect it to be too different.
And you know that you can count on us for sampling during the event tomorrow! Watch the data coming.
Olympic Mixed Relay Triathlon (August 5, 2024)
August 5, 2024 (23:30 pm)
We have the results for the 9:12 AM sample collected during the Olympic Mixed Relay Triathlon event. The planktonic count came in at 418 E.coli/100 mL, and the comprehensive count was at 1001 E.coli/100 mL. The laboratory MPN count is expected to be just slightly higher than the planktonic count, and we'll update with that result in the morning. These results indicate marginally acceptable water quality according to the World Triathlon safety threshold. It's a notable milestone, though the precise count of 1001 E.coli/100 mL serves as a reminder that this discussion is far from being over!
August 5, 2024 (21:31 pm)
We have just received the results from the measurement performed at 12:00pm today, which is indicative of the water quality at the Alexandre III bridge in Paris, just a couple of hours after the end of the Olympic Mixed Relay. The planktonic count came in at 506 E.coli/100 mL, which is below the World Triathlon threshold of 1000 E.coli/100 mL. But again, the comprehensive count was high, at 1338 E.coli/100 mL, which is above the limit. This is relatively consistent with what was measured yesterday, and places the water quality in the gray zone, with contradicting risk indications provided by the planktonic and comprehensive counts.
We will soon provide results from the morning sample, collected at 9:12am during the actual Mixed Relay Triathlon. A small communication issue slowed down the data retrieval, but it is coming in now and it will be posted soon. The laboratory MPN count from this morning's sample will only be availble tomorrow and it will be posted as an update to this live water quality blog.
Congratulations to the athletes, who were at their best this morning!
August 5, 2024 (07:59 pm)
It is happening ! The Fluidion team is all set to measure water quality for the 2024 Olympic Mixed Relay Triathlon, starting in just five minutes! Wishing all athletes an amazing competition and safe waters!
August 4, 2024 (23:59 pm)
We're sharing today's (August 4, 2024, 2:15 PM CET) latest water quality measurements for the venue of tomorrow's Mixed Relay Triathlon.
- Planktonic E.coli Count: 228 E.coli/100 mL (well below the World Triathlon threshold of 1000 E.coli/100 mL)
- Comprehensive E.coli Count: 1862 E.coli/100 mL (continues to be high)
- The laboratory MPN count would likely align closer to the planktonic count.
These results place us once again in the same gray zone observed during the Triathlon events on July 31st. While the risk associated with presence of planktonic E.coli is low, there is a significant risk related to E.coli-rich fecal or sediment particles floating in the water column. Since these E.coli bacteria are not visible to the standard laboratory methods, this risk is not captured and is therefore unknown.
Today's findings further highlight the inadequacy of the current regulatory methods to assess public health risk in waters like the Seine, which contain large amounts of suspended matter carrying clumps of E.coli bacteria and associated pathogens.
Click on this link to understand the difference between the laboratory count, and the planktonic and comprehensive counts we provide. Click here to understand the science.
August 3, 2024 (22:45 pm)
We have the results for today's measurements, started at 12:50pm. The water shows a significant improvement compared to yesterday: the planktonic count dropped to 704 E.coli/100 mL, which is below the Worldf Triathlon safety limit of 1000. However, the comprehensive E.coli count remains above the limit, at 1563 E.coli/100 mL, proving that E.coli-rich sediment and fecal particles are still present in the water column.
As we are writing this, it is raining in Paris. We hope that water quality will have sufficient time to improve by Monday morning. Our next sets of samples will be collected tomorrow, at multiple times throughout the day, at the Olympic Triathlon venue. Will keep you posted with what we learn !
August 3, 2024 (8:00 am)
What can we currently say ?
The observed pattern seem to confirm major sewage pollution originating within the City walls, which should normally have been retained by the Austertlitz sewage capture infrastructure. The 12mm rainfall on August 1st, which came on the back of multiple rainy days, likely overcame the capacity of the basin again, leading to its overflow. While we have no confirmation from the authorities that this is indeed the case, this is what the available data indicate.
Olympic Men's and Women's Triathlon (July 31, 2024)
- 8:05am - just after the start of the women's swimming leg
- 11:30am - just after the end of the men's swimming leg
- 12:50pm - just after Alex Yee won the Gold
An additional sample was brought to the lab for laboratory MPN analysis using EPA-approved methods, and for a control ALERT measurements of planktonic and comprehensive concentrations. Those results were only available on August 1st, see update above.
The detailed results are shown in the table below. Overall, the planktonic counts for all three samples were below the Triathlon thershold of 1000 E.coli/100 mL, with a geometric mean at 666 E.coli/100 mL, whereas the comprehensive counts provided a geometric count of 2203 E.coli/100 mL. The tendency was decreasing for the planktonic E.coli levels throughout the competition, but on the contrary, the comprehensive E.coli counts showed the opposite tendency, increasing from 1518 in the morning to 3538 E.coli/100 mL in the earlly afternoon. The comprehensive count for every sample was significantly higher than the 1000 threshold, with a geometric mean measured at 2203 E.coli/100 mL. This is more than a factor of 2 higher than the triathlon limit for acceptable water quality.
Note:
The laboratory MPN count will be available in the morning. We also sent samples for DNA analysis of various bacterial and viral human markers. We will be reporting on that when the results come in.
What do these results really mean ?
The water quality was in an unknown, and potentially unsafe, zone prior to and throughout the Triathlon competition. The planktonic E.coli count (free floating bacteria) was just below the acceptable threshold, yet particles of fecal and/or sedimentary origin, containing large quantities of E.coli and potentially other pathogens, were present in the water, raising the E.coli comprehensive count to significantly above the "acceptable quality" threshold.
This suggests that the official results significantly underestimate the real E.coli count, and the actual risk for the athletes is not managed and remains an unknown. We can nevertheless confidently say that the risk is substantially higher than what the laboratory counts suggest. We hope that none of the Triathlon competitors will become ill following the exposure to the Seine water in this intermediary and possibly unsafe state. Congratulations go to them for an amazing competition, despite the uncertainty around water quality which must have been highly disruptive!
Olympic opening ceremony (July 26, 2024)
Molecular DNA analyses
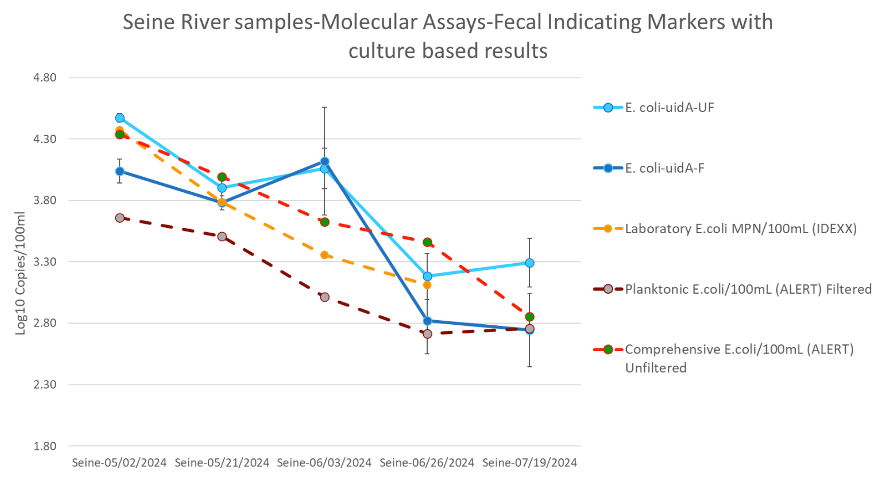
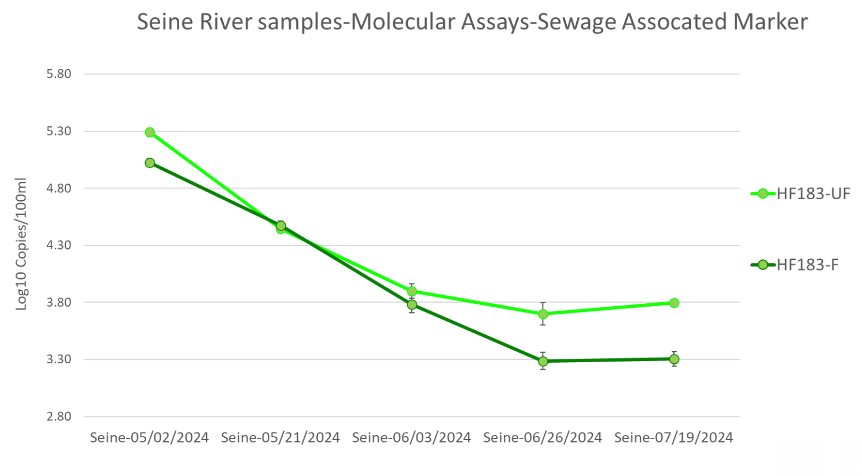
We also conduct molecular analyses of our samples to measure the quantity of E.coli DNA and detect the presence of HF-183 bacteroides, a human-associated sewage marker. These measurements are presented both as planktonic and comprehensive counts, showing trends similar to our culture-based ALERT measurements.
The molecular data confirms that the observed pollution is linked to human sewage, ruling out sources like agriculture or animal excrements (dogs, birds). Additionally, it reveals significant quantities of aggregate-bound human sewage components (clumped together on larger particles) rather than in free or planktonic form.
Traditional laboratory methods often overlook these aggregated bacteria, failing to capture the associated health risks in official assessments. In contrast, Fluidion ALERT technology and molecular methods offer comprehensive techniques that are sensitive to these aggregated bacteria, providing a more accurate picture of water quality and public health risks.
Laboratory MPN vs. Planktonic vs. Comprehensive E.coli counts

Science explained
Our article "Addressing Underestimation of Waterborne Disease Risks Due to Fecal Indicator Bacteria Bound in Aggregates" was recently published in the highly-respected Journal of Applied Microbiology. It had originally been uploaded as a bioRxiv preprint due to the urgency and importance of its findings, highlights significant limitations in traditional methods for detecting fecal indicator bacteria (FIB), such as E. coli, which fail to account for bacteria bound in aggregates, leading to substantially underestimated waterborne disease risks. ALERT technology, developed by Fluidion, is an automated rapid method for measuring both planktonic (free-floating) and comprehensive (including aggregate-bound bacteria) E.coli counts. In certain waters, the comprehensive measurement can provide much higher bacterial counts than traditional methods. The study underscores the need to update global water safety regulatory frameworks to include more accurate testing methods and automation, enhancing water quality monitoring and public health protection, and enabling monitoring in resource-limited or remote locations, which do not have access to laboratory services.
Key points:
Limitations of Traditional Methods:
The study highlights significant limitations in traditional culture-based methods for detecting fecal indicator bacteria (FIB), such as E. coli. These methods fail to account for bacteria bound in aggregates, leading to substantial underestimation of waterborne disease risks. This underestimation can severely skew public health risk assessments and highlights the limitations of the current regulatory frameworks to protect water users in waters containing fecal or sediment particles, such as urban rivers subject to combined sewer overflows.
ALERT Methodology:
The research uses ALERT as a new technology for automated rapid method for comprehensive quantification of culturable bacteria. ALERT can measure both planktonic (free-floating) and comprehensive bacteria (which are bound in aggregates, such as on fecal or sediment particles), providing more accurate risk assessments. This method revealed that aggregate-bound bacteria are present in much higher quantities than detected by traditional methods, creating a major and currently non-monitored risk. This risk is particularly highlighted in the water of the Seine river in Paris, venue for the 2024 Olympic Triathlon and Marathon swimming events.
Implications for Water Safety:
The study's findings underscore the need for updating global water safety regulatory frameworks to include methods that can accurately measure comprehensive E.coli counts, including aggreagate-bound bacteria. Incorporating such comprehensive methods can improve water quality monitoring, particularly in recreational and agricultural water uses, but also for drinking water assessment in remote locations without managed distribution networks. ALERT can better protect public health by providing more accurate risk assessments.
Methodology
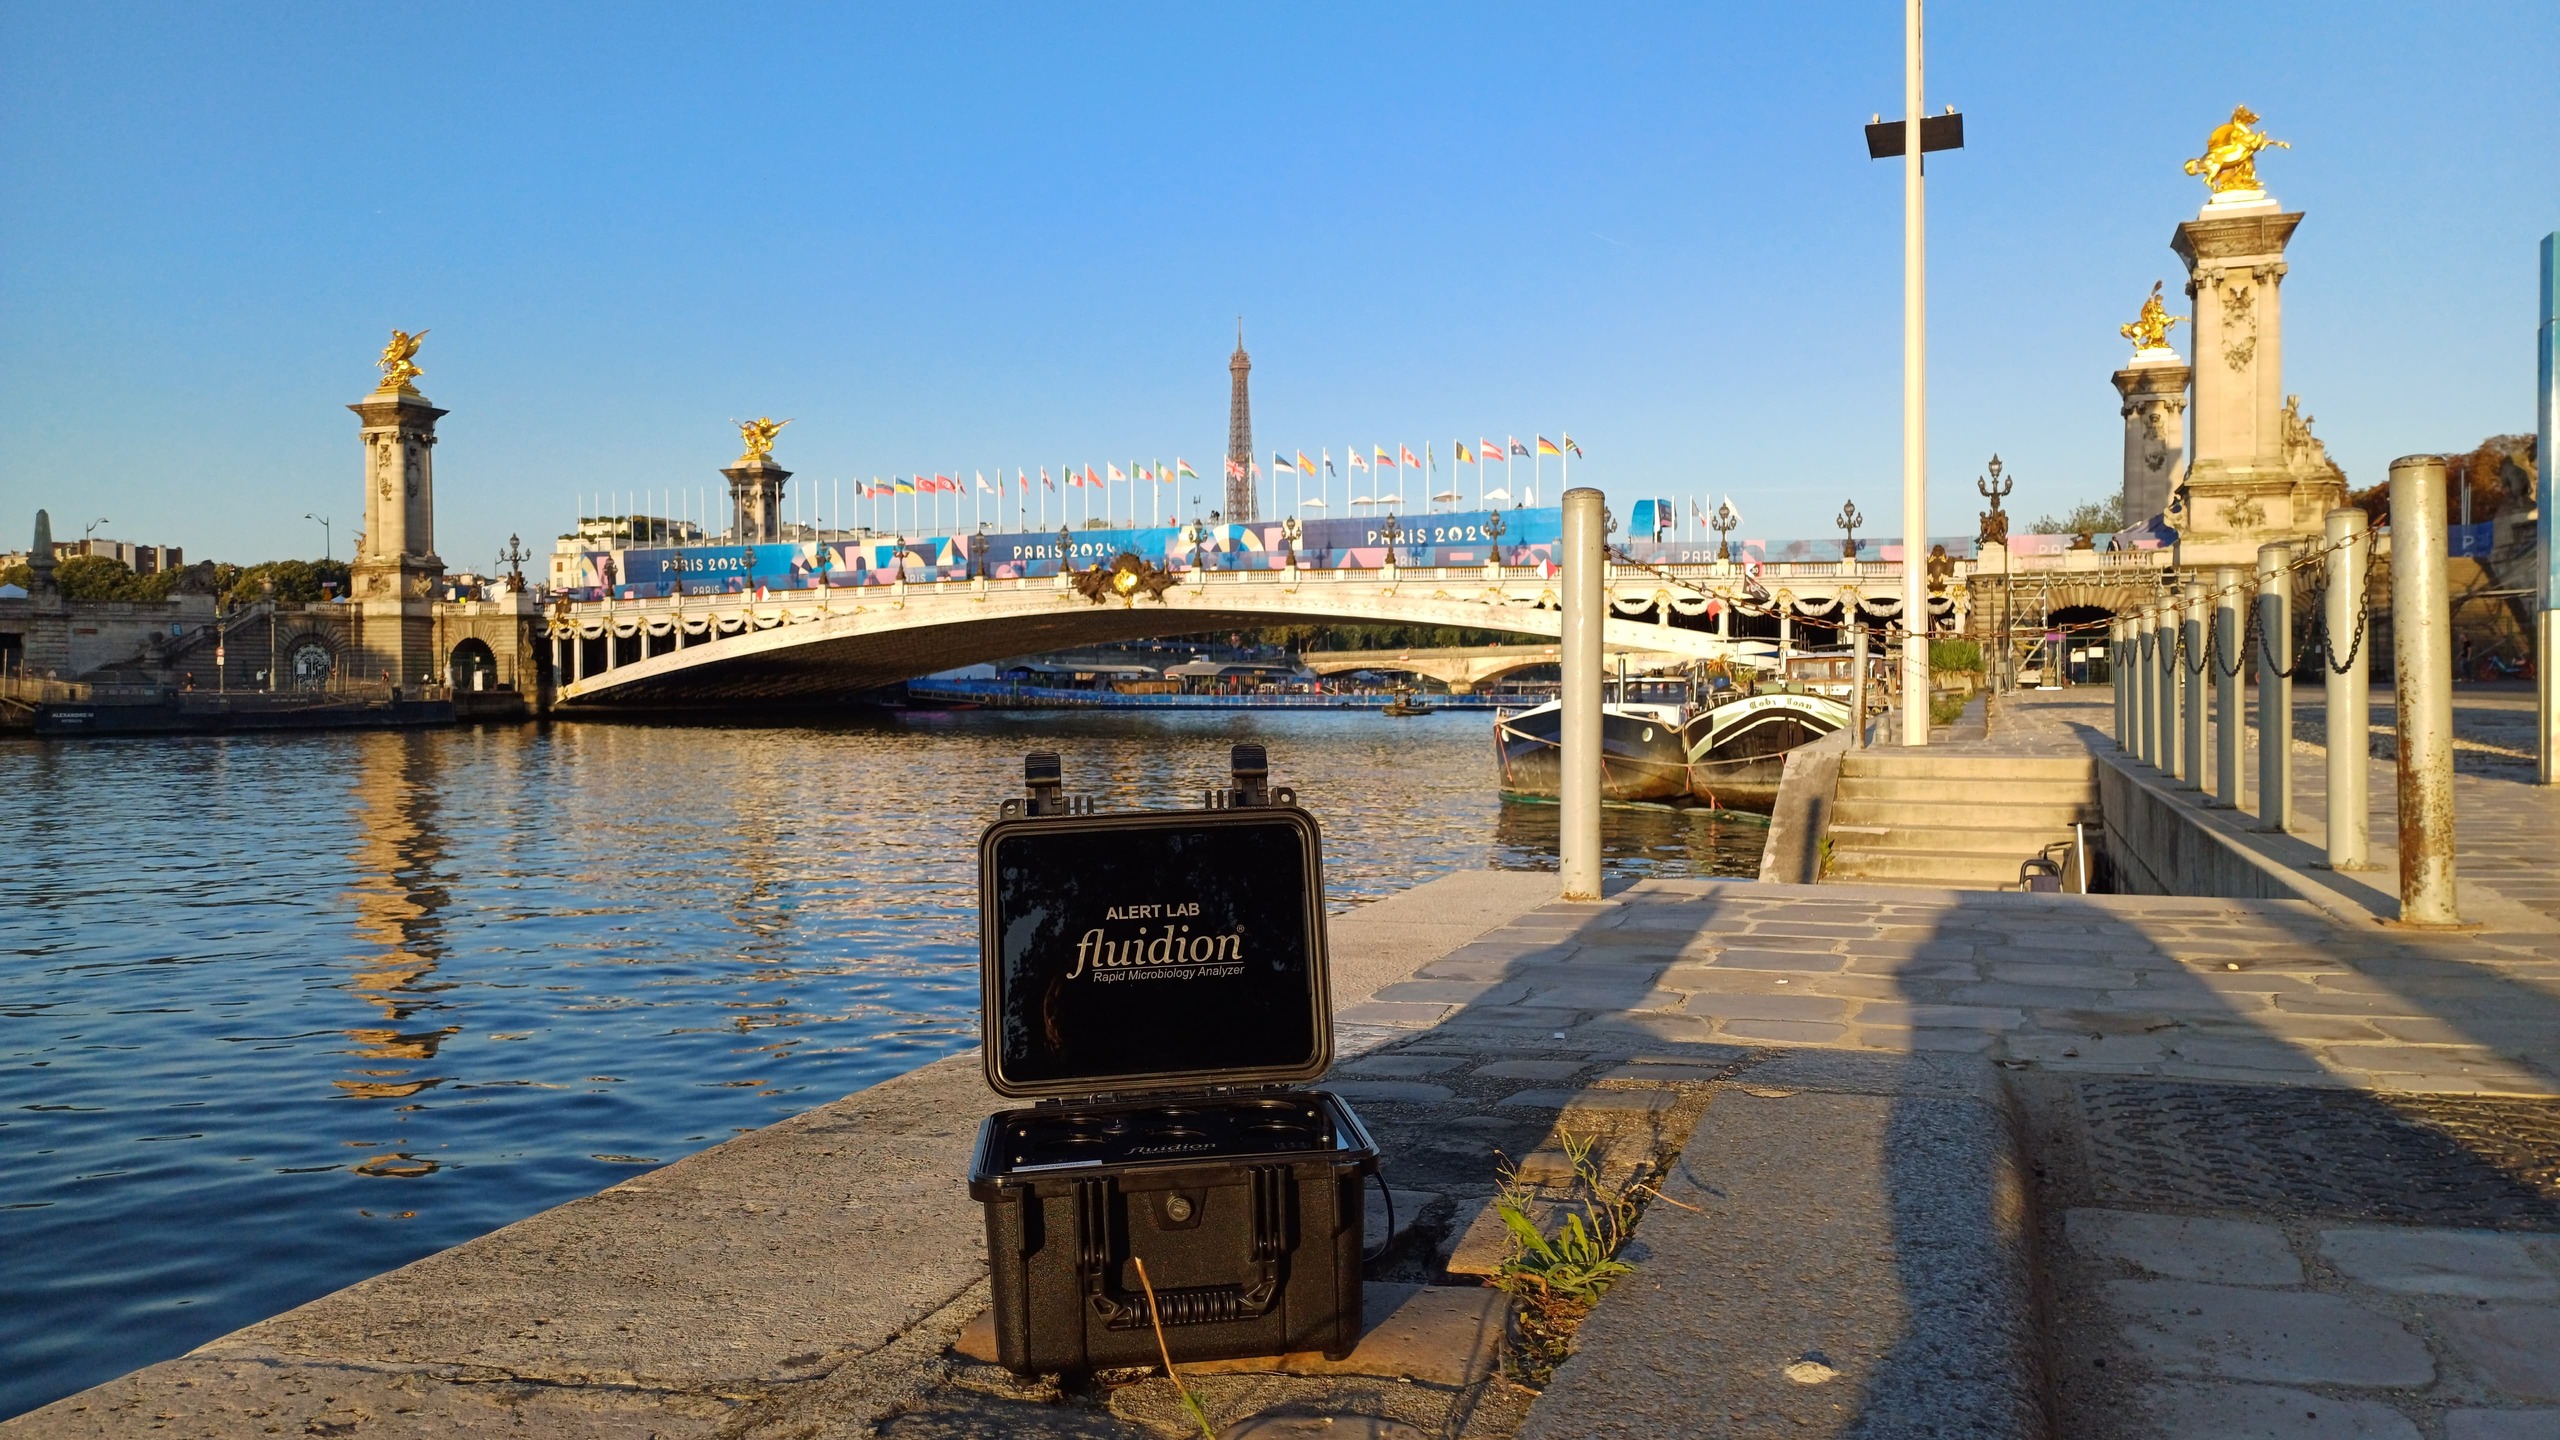
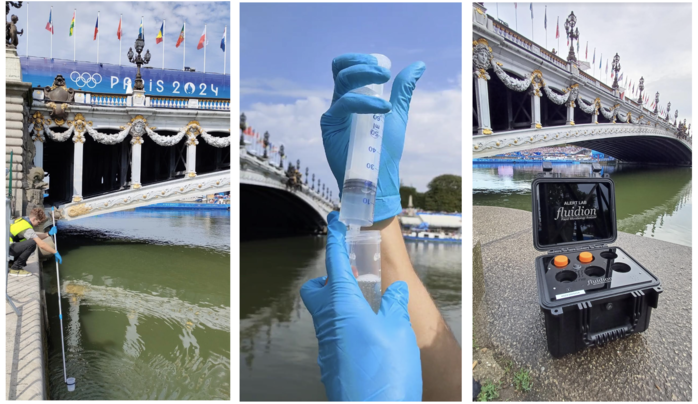
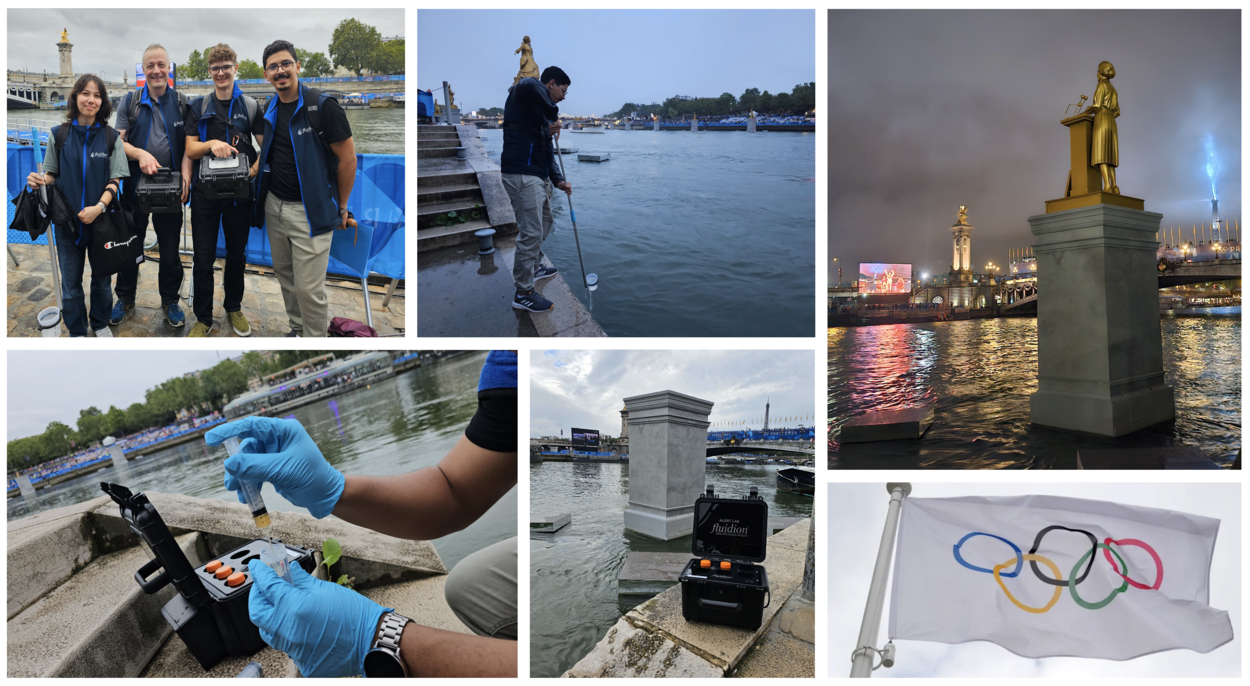
Samples were collected near the Alexandre III bridge (GPS coordinates: 48.863248, 2.314508) using standard grab sampling techniques, and then either processed onsite or transported to the laboratory in a cooler with ice. In the laboratory, samples were processed immediately.
Rapid microbiology ALERT data were obtained using Fluidion® ALERT LAB portable E. coli analyzers. Samples were analyzed as-received (to measure the comprehensive E.coli concentration) but also after 5µm filtration (to measure the planktonic E.coli concentration). 95% confidence intervals (CI) were obtained from peer-reviewed published scientific literature.
Laboratory most probable number (MPN) measurements were performed using the EPA-approved IDEXX Colilert-18 Quantitray-2000, following standardized protocols. Samples were measured as-received and also with a dilution of 1:100, to extend the measurement range of the MPN method. Dilutions were performed using sterilized glassware and autoclave-sterilized de-ionized water. The MPN laboratory measurement values and 95% CI were obtained from the IDEXX Quanti-Tray®/2000 MPN Table (per 100 mL) with 95% Confidence Limits.
Historical rainfall data in Paris (measured at the Montsouris station) were obtained from: https://prevision-meteo.ch/climat/mensuel/paris-montsouris. Historical Seine River discharge data (measured at the Austerlitz bridge in Paris) were obtained from: https://www.hydro.eaufrance.fr/stationhydro/F700000103/fiche
Open data availability
All data available here belong to Fluidion and are protected by copyright. Any use of the data must provide a clear reference to this website and include the following text: "Data provided courtesy of the Fluidion Open Data Initiative". Whenever multiple measurements were performed on a single day, their geometric mean is shown. The data presented on this page are available for download in various plain text and open source formats, shown below. Fluidion assumes no responsibility for any specific usage or any decisions made that are based on these data. Any use of the data is under the sole responsibility of the end-user.
Data formats:
- Comma-separated values (CSV)
Disclaimer and Copyright Notice
To clarify: Fluidion is an entirely independent organization, with no affiliations with the City of Paris or the 2024 Olympics committee. We stand by our Open Data Initiative, rigorous scientific practices, and ethical standards. The data we provide are our property, shared transparently as part of our Open Data Initiative. These data are protected by copyright and require proper attribution as specified below.
The water quality data presented on this page are collected and reported by Fluidion as a best-efforts attempt to offer accurate, timely, and accessible information about the Seine River quality leading up to and during the Olympic events. The data come from samples collected by Fluidion personnel and trained citizen scientists under Fluidion’s supervision. Samples are taken from the Seine at the Alexandre III bridge in Paris, the site of the 2024 Olympic events.
These data are quality-controlled by Fluidion scientists, which may result in delays in data availability. Any errors found in the data are unintentional, and corrections are made immediately upon detection. The information and data provided are intended solely for scientific purposes. Fluidion assumes no responsibility for specific uses of these data, which are at the sole risk of the end-user.
All data presented on this page belong to Fluidion and are protected by copyright. Any use of the data must provide a clear reference to this website and include the following text: "Data provided courtesy of the Fluidion Open Data Initiative".
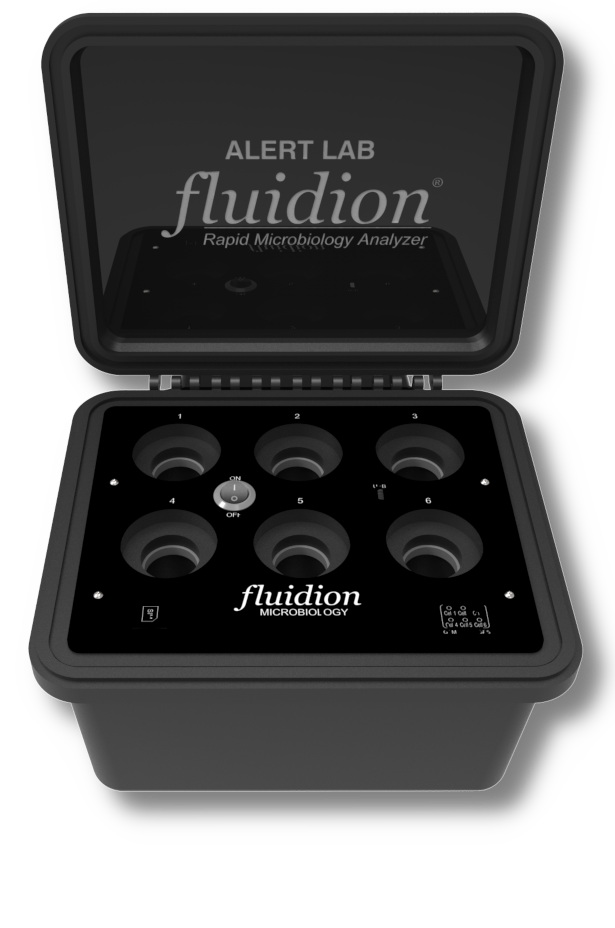
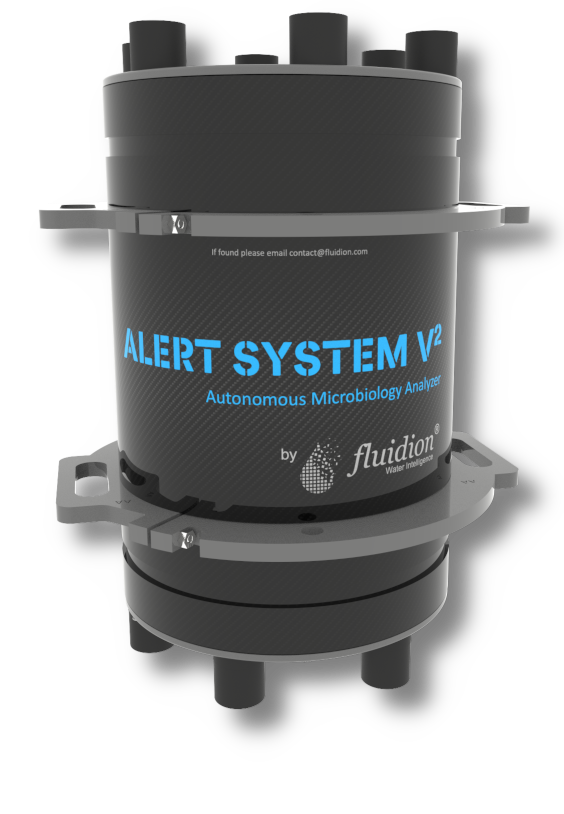
Related Products
Several Fluidion products are well-adapted for Recreational Water applications, by providing rapid microbiological risk information from instruments with extraordinary ease-of-use, that are fully-automated and perform automatic remote data transmission and archival. Below is a selection of recommended products: